 Functional Blood Analysis and Optimal Ranges
Going to a doctor with various chronic symptoms and health complaints just to go home without answers may sound familiar to you. It’s a common problem. According to your doctor, your tests are fine and everything is looking normal. Yet you are tired and weighed down by symptoms. Things are not feeling normal by any means.
Unfortunately, many regular doctors are reluctant or unable to run many functional lab tests that may be needed to detect some underlying issues causing your symptoms. An even bigger problem is that instead of looking at what’s optimal, they are only looking at what’s normal.
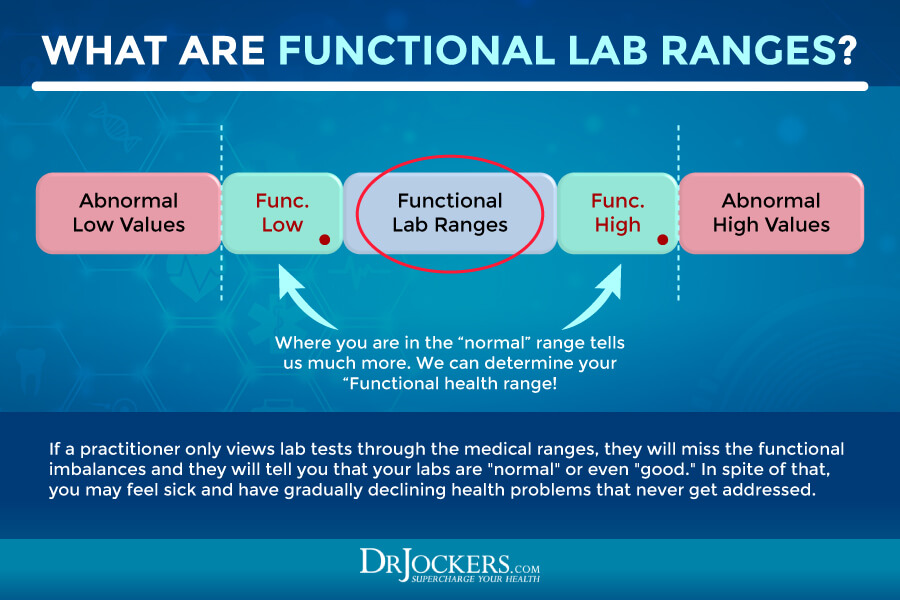
Normal is not the same as optimal. If your results lay on the very low end of the normal range, for example, it may mean that there is an imbalance or health issue we have to look at. Functional medicine practitioners, like myself, use functional blood analysis and other tests to look at optimal ranges to help recognize even subclinical health challenges and risk of health problems.
Looking for optimal ranges may help us to identify the underlying issue behind your symptoms and help us recommend a treatment plan to move anything out of balance back to the optimal range to help you regain your energy, health, and well-being naturally.
In this article, I will discuss what a functional blood analysis is and why it’s so important. I will explain the benefits of a Complete Blood Count (CBC) and a Complete Metabolic Panel (CMP) to check for potential underlying health issues and risk of disease. You will learn about the optimal functional health range for each health marker of these tests.

What Is Functional Blood Analysis
Have you ever been to a doctor with chronic complaints just to be told that your blood tests are normal and you are just fine? You are not alone. I see patients all the time who have seen their regular doctors. They ran some tests. Then they were told that everything was looking good. But why were they feeling so off then?
Here is the thing, normal is not always optimal. Regular doctors look at the minimal number of tests. They also look at your blood markers differently than us, functional medicine practitioners do. If your results are on the low end of the ‘normal’ scale, they will likely declare that everything is great without further digging.
But again, normally doesn’t mean optimal, ideal, or even healthy. Just because your blood test results may have not yet reached a state of a diagnosable serious disease, it doesn’t mean that everything is ‘great’.
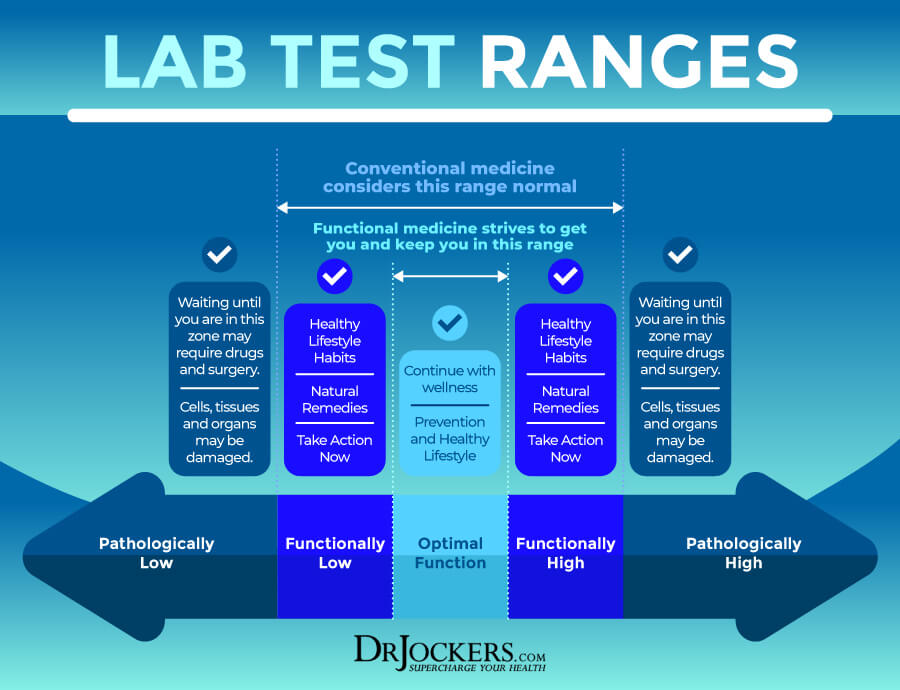
Being on the lower or higher end of normal or ‘just outside’ the normal range may indicate less than optimal function, underlying health issues, and risk of disease. Being off from optimal means that something needs attention to correct imbalances, deficiencies, inflammation, or other issues to regain balance, optimal function, and good health.
Functional Blood Analysis Insights
Using a functional blood analysis, functional medicine practitioners, like myself, can look beyond statistical averages. These tests tend to look at more factors than tests that conventional medical doctors are able to look at. Since conventional blood test analysis and interpretation can be inadequate at recognizing underlying health issues or noticing health problems or their risk early on.
Functional blood analysis looks at broader reference ranges to help us identify subclinical problems and the risk of disease before they can manifest into a full-blown, serious health issue. Of course, they can also help us diagnose more serious issues and full-blown diseases as well.
Functional blood analysis is a great tool for prevention, risk assessment, early diagnosis, and treatment. Functional blood analysis, however, is not the only way to diagnose acute health conditions or chronic diseases. Understanding your symptoms, health history, family history, diet, lifestyle, and emotional factors is always critical. We may also use stool testing and many other functional lab analysis. In some serious cases, like cancer, you may need a scan, genetic testing, or other tests.
However, functional blood analysis is a test we, functional medicine practitioners, often use and recommend to look for subclinical health challenges that are impeding optimal function. It is the first step to identify gaps and problems and it’s incredibly helpful for prevention.
In this article, I will discuss the benefits of a Complete Blood Count (CBC) and a Complete Metabolic Panel (CMP) to check for potential health issues and risk of disease. These are the most commonly run labs that even most general practitioners run on all their patients. However, I will go over the optimal ranges we are looking at a functional medicine office. You will also learn why I recommend the Complete Blood Analysis (CBA) blood test to look at these and other functional health markers.
Complete Blood Count
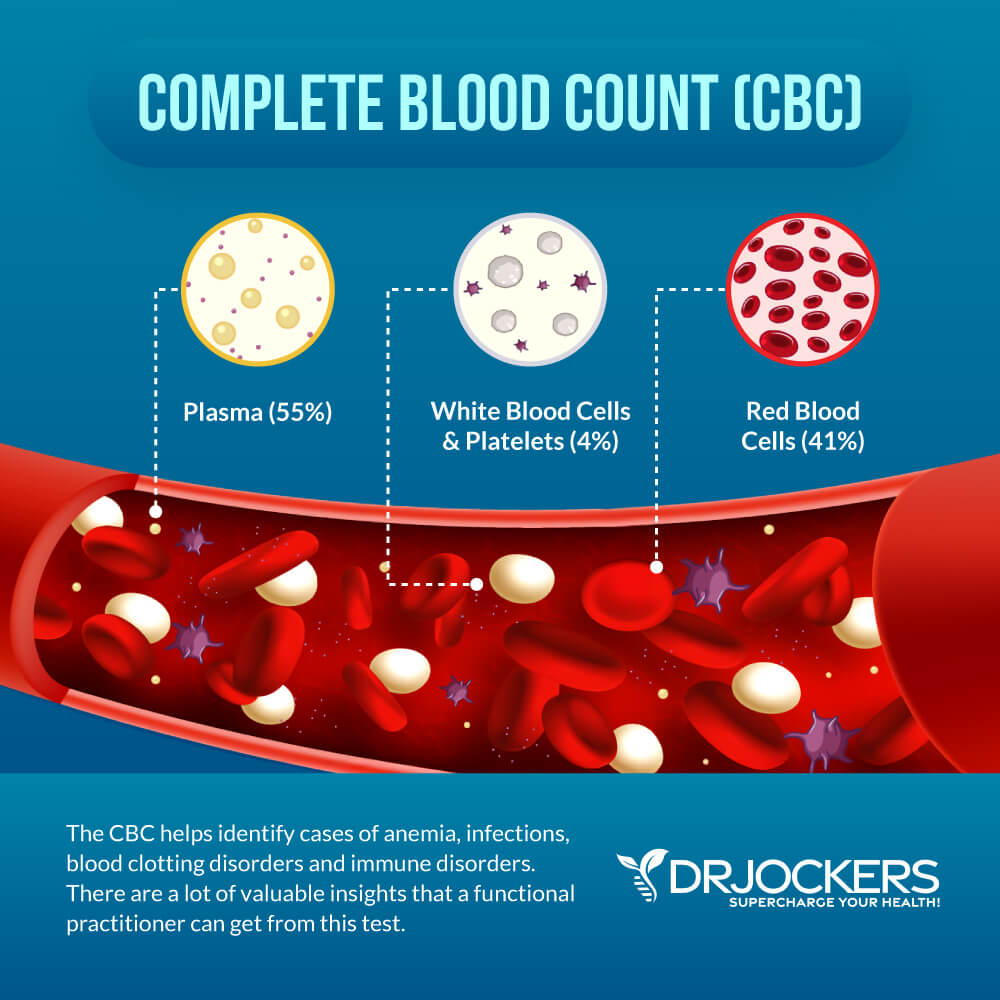
First, in terms of a functional blood analysis, let’s look at the markers of the Complete Blood Count, also known as CBC. The CBC is a test that even general practitioners run at conventional doctor’s offices during your annual physical or if you have health issues. It is a group of tests that looks at the cells that circulate in your blood. It looks at your red blood cells (RBCs), white blood cells (WBCs), platelets (PLTs), and other factors.
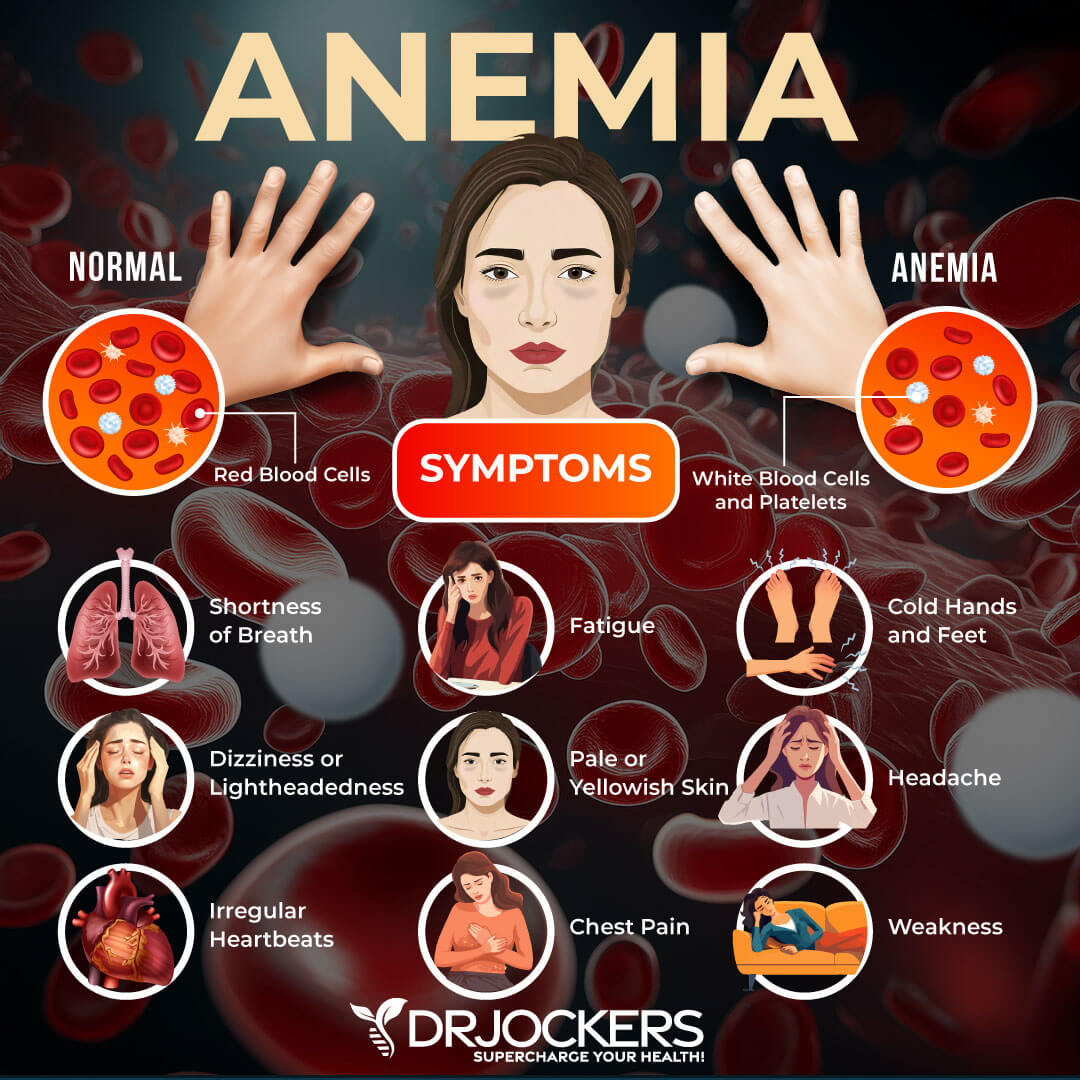
The CBC can help to detect and diagnose various diseases and health conditions, including anemia, infections, and leukemia. It can also help to evaluate your overall health and when looking at functional health optimal ranges, it can help to detect your risk of disease, and health areas we need to address to optimize your health and well-being naturally.
White Blood Cell Count
Your white blood cells are an important part of your immune system that help to fight viruses, bacteria, and other foreign pathogens that may cause an infection, illness, or other diseases. If your body is fighting a virus, bacteria, or other substance, your white blood cell count will increase. Certain diseases, including HIV/AIDS and certain types of cancers, may actually lower your white blood cells compromising your immune system. Chemotherapy and some other medications may also decrease the white blood cells in your blood (1, 2, 3).
A white blood cell count (WBC or WBC count) is used to measure the number of white blood cells in your blood. A WBC count is used to diagnose different illnesses and disorders. Bacterial infections, viral infections, autoimmune disease, inflammatory conditions, allergic reactions, and some cancers, including leukemia and Hodgkin disease, are some health issues that can result in a high WBC count.
HIV/AIDS, liver disease, spleen disease, and lymphoma (cancer of the bone marrow) are examples of diseases that can cause low WBC count (2, 3). According to a 2017 study published in the American Journal of Epidemiology, high blood cell count in women is also associated with coronary heart disease and total mortality (4).
The optimal range is between 5 and 8. Above 8 is usually a sign of acute infection and below 5 is a sign of immune suppression.
There are five main types of white blood cells that a WBC is looking for, including neutrophils, lymphocytes, monocytes, eosinophils, and basophils. A regular WBC count checks the total number of white blood cells in your blood. Your doctor can also order a blood differential. A blood differential is another blood test that can measure the amount of each of these types of blood cells. Read on to learn more about these specific white blood cells and the optimal range for each.
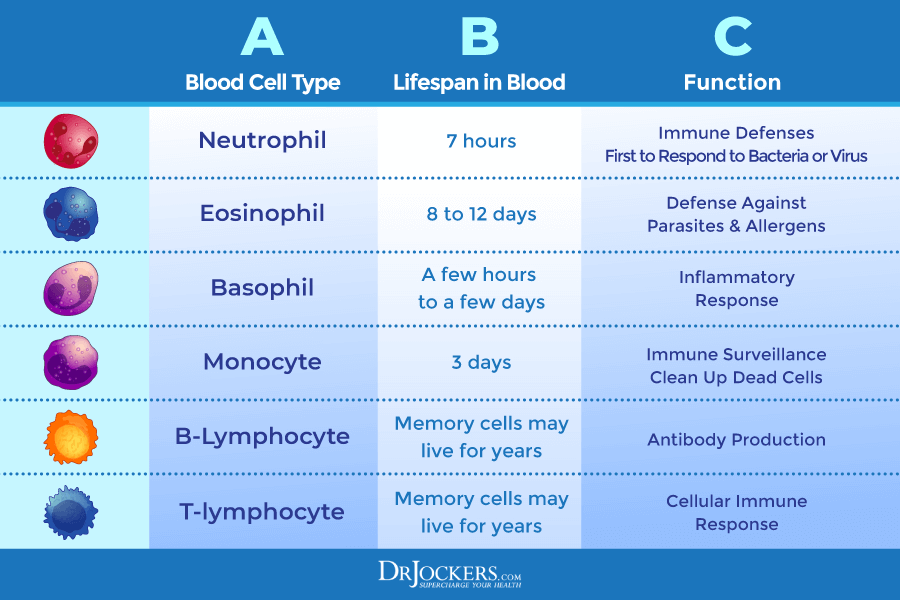
Neutrophils
Neutrophils are very powerful white blood cells that specialize in killing bacteria and fungi. Neutrophilic leukocytosis means that you have elevated neutrophils in your body. This may be a part of a normal immune response to inflammation, infections, injury, certain medications, or certain forms of leukemia.
The optimal range for neutrophils is 40 to 60 percent. Bacterial infections and chronic inflammation will drive this up by over 60 percent.
Lymphocytes
Lymphocytes are essential for making antibodies that protect you from viruses, bacteria, and other invaders. The term lymphocytic leukocytosis refers to having elevated levels of lymphocytes. It often occurs due to viruses, infections, like tuberculosis, and certain leukemias and lymphomas.
The optimal range for lymphocytes is 20 to 40 percent. Chronic viral infections can drive this up over 40 percent or in some cases down below 20 percent.
Monocytes
Monocytes help to fight and break down germs and bacteria. Elevated levels of monocytes may mean that there is a chronic infection, autoimmune disease, or blood disorder, or other health issues present.
The optimal range for monocytes is 4 to 7 percent. Above 7 percent can be a sign of inflammation and also mononucleosis or Epstein Barr Virus can drive this way up.

Eosinophils
Eosinophils help to fight and destroy parasites and cancer cells. They also play a role in your body’s allergic response. Eosinophils levels often become elevated due to parasites, allergies, or asthma.
The optimal range for eosinophils is 0-2%. High levels may indicate an allergy or parasitic infection.
Basophils
Basophils can send messages to your body that there is an infection on the rise by secreting chemicals into your bloodstream. Their role is mainly to combat allergies. Basophils levels often become elevated if there is a thyroid condition, such as hypothyroidism, or other health issues present.
The optimal range for basophils is 0 to 2 percent. High levels may indicate histamine, allergy, leukemia, or infection.
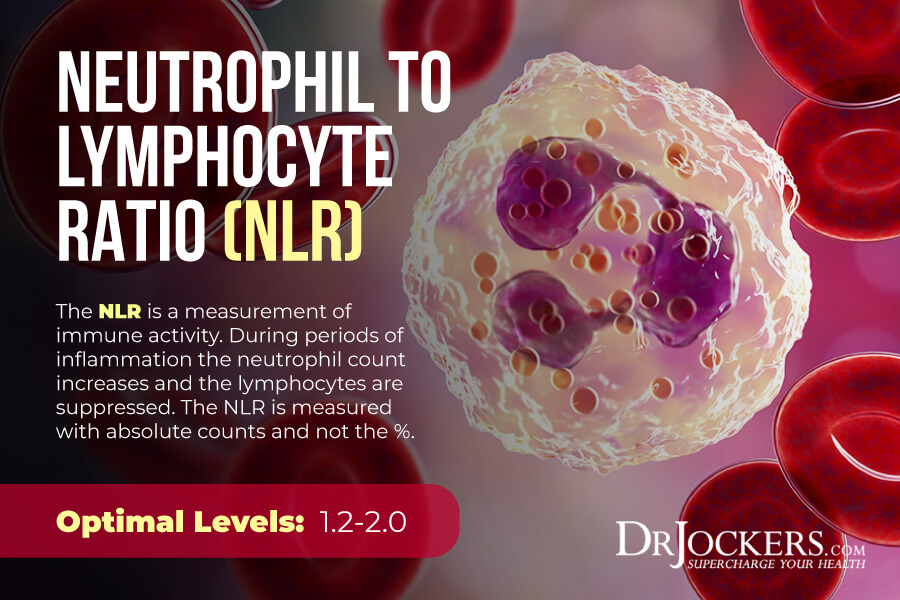
Neutrophil to Lymphocyte Ratio
Beyond the optimal levels of these specific white blood cells, your neutrophil to lymphocyte ratio matters too and should be looked at as well. Neutrophil-Lymphocyte Ratio (NLR) is a measure of stress and inflammation that may affect your health. According to a 2012 study published in the International Archives of Medicine, NLR is a good measure of inflammation associated with prevalent chronic diseases (5).
When the body is dealing with chronic inflammation, over time, the lymphocyte levels will drop and the neutrophil levels will rise and cause an imbalance. NLR is usually measured with the absolute count and we want to see it at roughly 1.2 to 2.0. If you see that the number of neutrophils is more than twice the amount of lymphocytes it is a sign of chronic inflammation.
Red Blood Cell Count
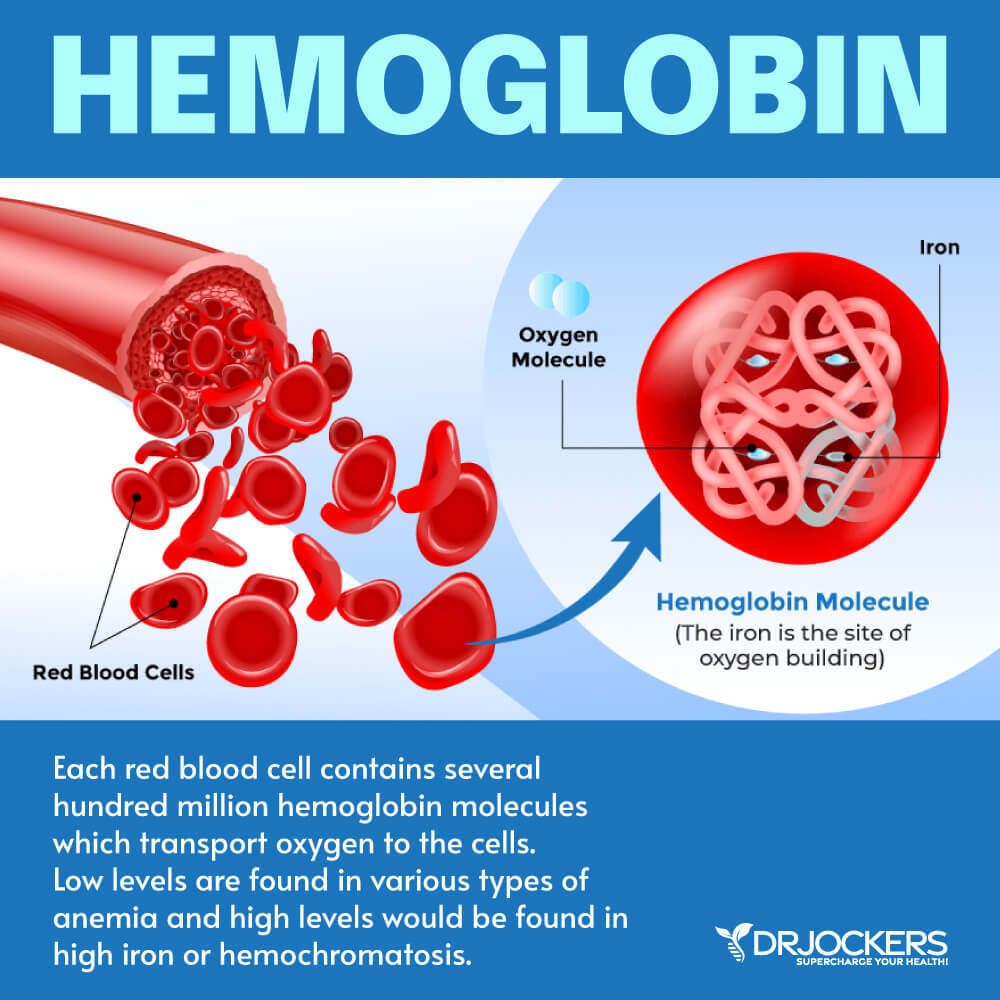
Your red blood cells are blood cells that contain hemoglobin, which is a substance that transports oxygen across your body. How much oxygen your body is able to deliver to certain tissues depends on the number of red blood cells you have and the function of these red blood cells.
A red blood cell count (RBC or RBC count) is usually part of your CBC. The RBC count measures the number of red blood cells in your blood. It can detect various infections, anemia, immune system disorders, clotting issues, blood cancers, and other health issues (6, 7, 8).
The optimal range for RBC is 4 to 5. For menstruating women, it will often be 4 to 4.5. For men and post-menopausal women, we often see 4.4 to 4.9. High levels of RBC may indicate dehydration as the most common cause. Low levels often indicate functional anemia. Real anemia would be under 3.77.
A CBC also looks at the numbers as the size of platelets, hemoglobin levels, hematocrit levels, reticulocyte count, and mean corpuscular volume (MCV). Let’s look at what these factors mean and their optimal levels.
Hemoglobin
Hemoglobin is an iron-rich protein in your red blood cells that carries oxygen across your body. It affects how much oxygen your tissues get and thus, affects your tissues’ function. Dehydration, altitude, and bone marrow disorders can cause high levels, while anemia is often behind low hemoglobin. For an official diagnosis of anemia, the red blood cells need to be below 4.14 and the hemoglobin levels below 13 g/dL
The functional or optimal range for hemoglobin is 13.5 to 14.5 g/dL for women and 14 to 15 g/dL for men. High levels can be linked to high iron (possible hemochromatosis) and low levels can be a sign of functional anemia.
Hematocrit
Hematocrit is the whole blood volume that consists of red blood cells. Hematocrit levels can turn low in iron deficiency anemia or if excessive bleeding has occurred. This value may be high in times of dehydration or polycythemia, which is the overproduction of hemoglobin.
The optimal ranges for hematocrits for men are 39 to 45 percent while for women they are between 37 to 44 percent. High hematocrit levels often mean dehydration or polycythemia vera, which is an overproduction of hemoglobin. Low levels often mean anemia, bleeding, sickle cell anemia, or over-hydration.
MCV
MCV stands for the mean corpuscular volume and is the average volume of a red blood cell. Iron deficiency, vitamin deficiencies, and red blood cell problems often cause unhealthy MCV levels
Optimal levels of MCV are between 85 and 92 fl. Low MCV is related to a microcytic, or iron deficient, red blood cell. High MCV is related to a megaloblastic, or vitamin deficient, red blood cell.
MCH
MCH stands for mean corpuscular hemoglobin. This is the average mass of hemoglobin per red blood cell. Various types of anemia and folate of B12 deficiencies may cause MCH issues.
The optimal ranges for MCH are between 26 and 33 pg while the functional ranges for optimal health are between 28 and 32 pg. High levels indicate megaloblastic anemia associated with deficiencies in folate or B12. Low levels indicate microcytic anemia which is typically associated with blood loss or low iron levels.
MCHC
MCHC stands for mean corpuscular hemoglobin concentration. This is the average concentration of hemoglobin in red blood cells. Anemia is often the culprit behind poor MCHC levels.
The optimal levels of MCHC are between 32 and 35 g/dL. A decrease in MCHC is an indicator of hypochromic, or iron-deficient anemia. A high MCHC value indicates methylation issues and is megaloblastic anemia.
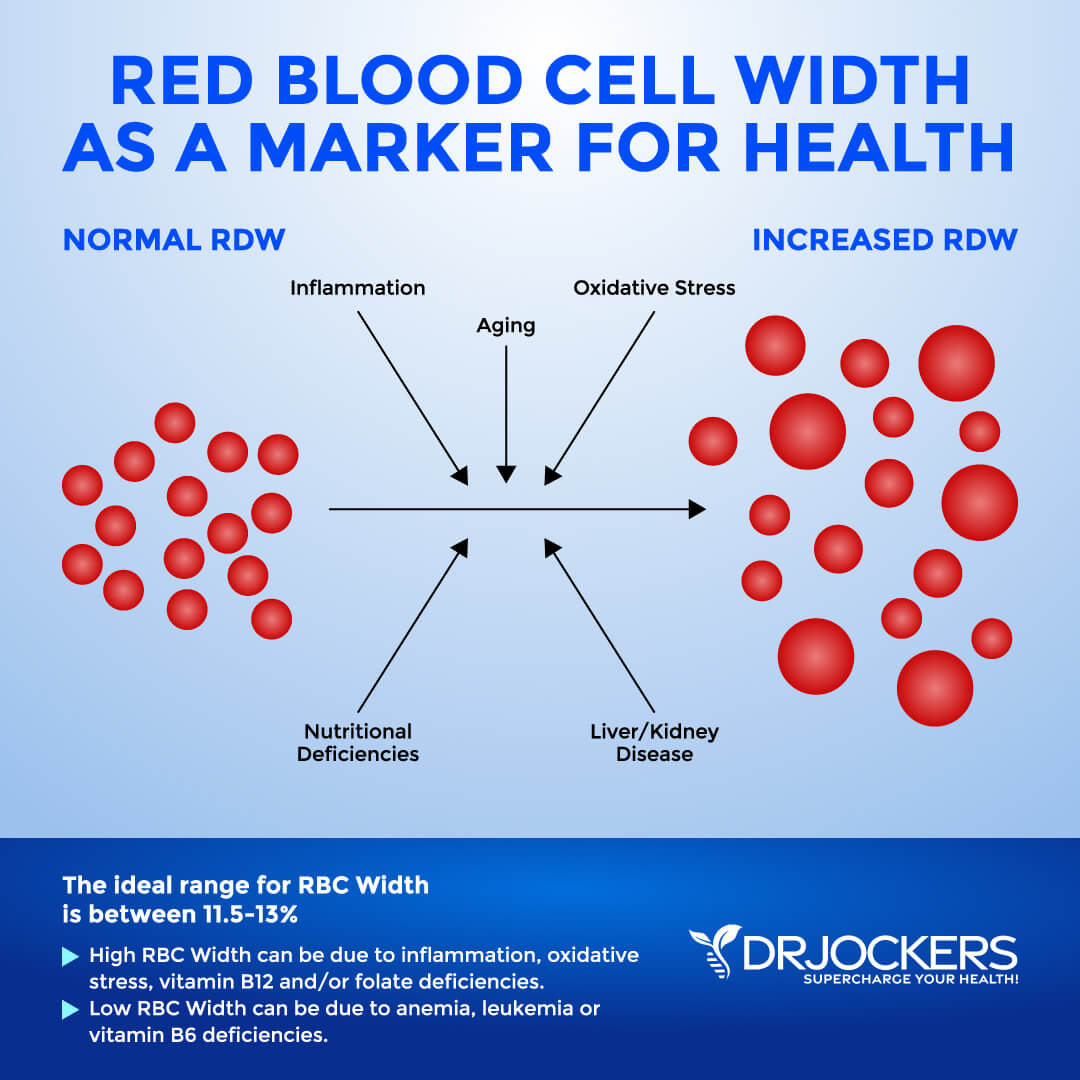
Red Blood Cell Width
The size of your blood cells has to do with maturation process which depends on methylating agents, such as folate and vitamin B12. Red Blood Cell Distribution (RDW) markers are a great way to detect underlying inflammation in your body. A 2018 study published in Science Reports has found that RDW levels may be linked to sarcopenia, an inflammation-related condition affecting older people (9).
The clinical range is between 12.3 and 15.4 percent while the optimal range is 11.5 and 13 percent. When this level is above 13% it may be a sign that inflammation has impacted the development of the red blood cell.
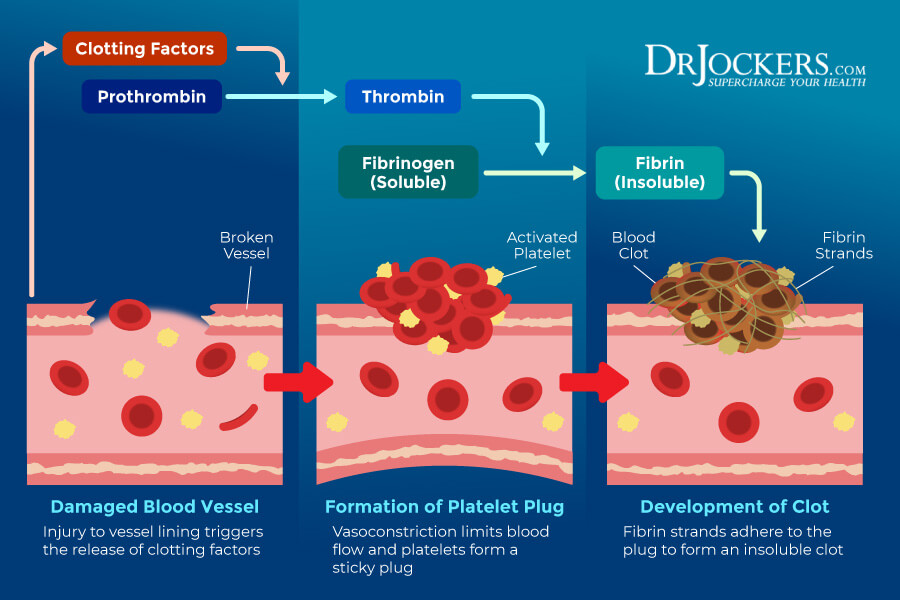
Platelets
Platelets are your smallest blood cells. They look like small plates in their nonactive form. When a blood vessel becomes damaged, it will send a signal to your platelets that in response will then travel to the area. They then turn into their active form and contact with your broken blood vessels. They grow tentacles that look like an octopus to protect the broken area. Platelets essentially support coagulation to reducing bleeding by clotting blood.
The optimal ranges of platelets are 175 to 250. Thrombocytopenia refers to having low platelet levels. Low platelet levels are often associated with increased destruction for autoimmunity or making too few platelets due to cancer. Certain infections, such a dengue fever, may also cause low platelet count. High platelet levels are usually linked to inflammation. Very high platelet levels over 400 may be linked to thrombocytosis, a coagulation disorder due to chronic inflammation.
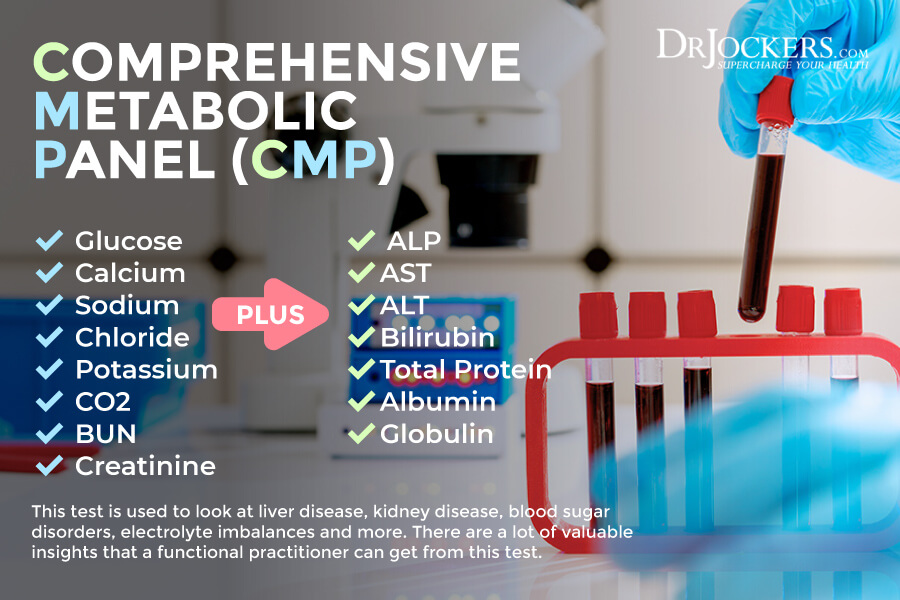
Comprehensive Metabolic Panel
Now that you understand the CBC, let’s look at another common blood test, the Comprehensive Metabolic Panel, or CMP The CMP is a comprehensive blood test that looks at 14 different measurements, including liver function, kidney function, nutrient balance, abnormalities in blood sugar, and more.
This test may help to screen for, diagnose, as well as, monitor various conditions, including liver disease, kidney disease, and diabetes. When looking at the functional blood analysis for optimal ranges, it can help us, functional medicine practitioners, to identify underlying health issues and risk of disease, as well as offer recommendations to correct imbalances or health issues to regain optimal energy, health, and balance naturally (10, 11, 12, 13).
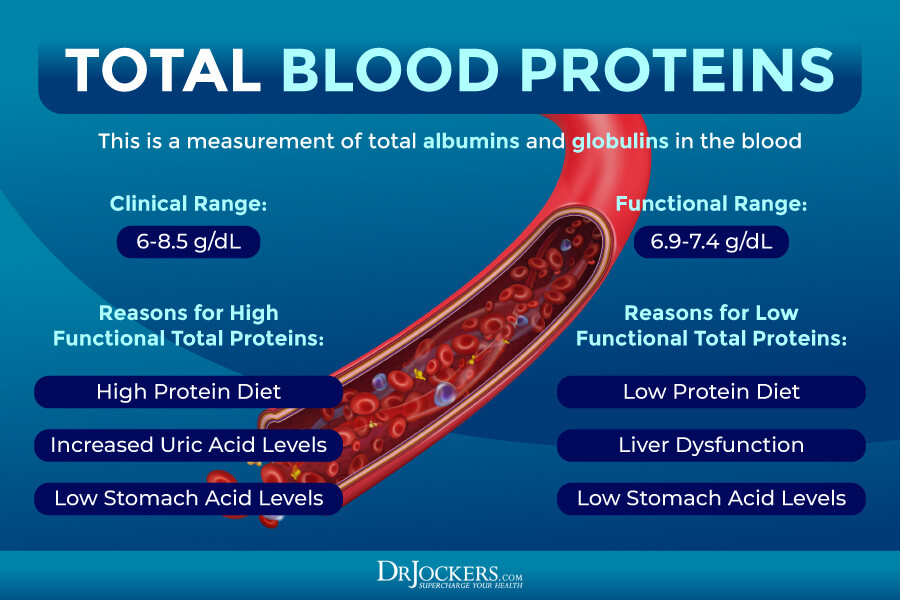
Total Protein
One of the markers the CMP looks at is your total protein. Total protein, not surprisingly, measures the total protein levels in your blood. Serum proteins are separated into albumin and globulins, albumin being the one at the highest concentration. Too much or too little protein in your diet can often cause elevated or low levels of total protein. Uric acid and HCL levels can also affect your total protein count.
The clinical range here is 6.0-8.5 g/dL and if these levels are high it is an indication of an infection, bone marrow disease, liver dysfunction or dehydration. Low levels are an indication of a liver or kidney disease or malabsorption.
The optimal range for total is 6.9 to 7.4 g/dL. High levels may indicate a high protein diet, increased uric acid, or low HCL. Low levels may indicate a low protein diet, liver dysfunction, or low HCL. Low HCL is commonly caused by an H pylori infection, gut inflammation, dysglycemia, or hypothyroidism.
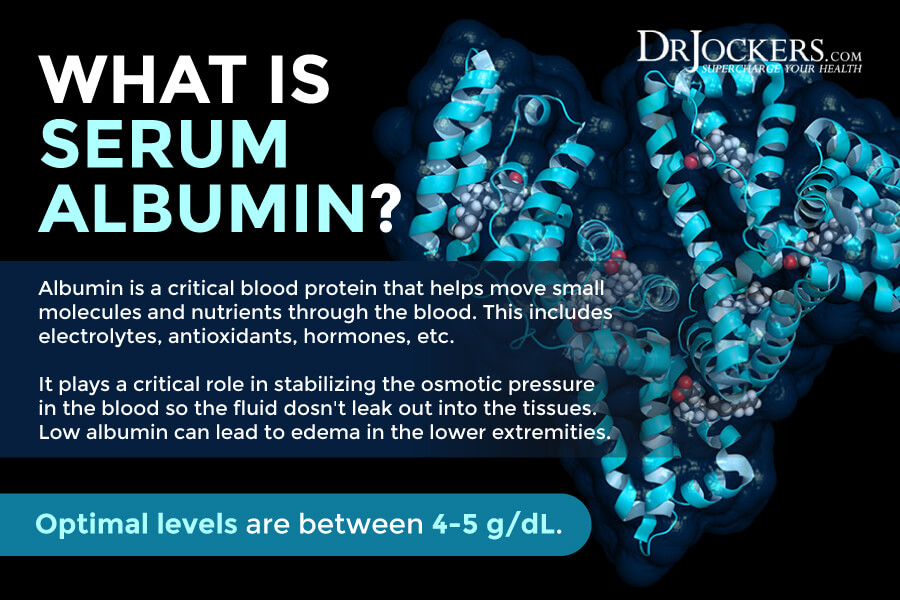
Albumin
Serum albumin is one of the most important blood proteins in human plasma. Most of it is produced by your liver. Albumin helps to transport nutrients and electrolytes, including potassium, calcium, and sodium, antioxidants, including glutathione, and hormones, such as thyroid T4. Low albumin levels may increase the risk of mortality. Low glutathione levels, a low-protein diet, and a vegetarian diet may all risk deficiencies in albumin.
Optimal albumin levels for albumin are between 4 and 5 g/dL. Low levels of albumin may indicate poor liver function, low glutathione levels, low levels of antioxidants, oxidative stress, or protein deficiency. When albumin is over 5, it is often an indicator of dehydration, acute infections, burns, recent surgery, or a heart attack.
Additional signs of oxidative stress other than low albumin include low lymphocytes (under 20 percent), high uric acid (above 5.9), decreased platelet levels (under 150), high LDL:HDL cholesterol ratios (over 3:1), and high globulin levels (above 2.8).
Globulin
Globulin is a protein that makes up your blood cells, including hemoglobin, antibodies, and blood clotting. Low HCL levels can increase your risk of elevated levels of globulin, while gut issues or liver problems can lead to low levels.
The optimal range for globulin is between 2.4 and 2.8 g/dL. High levels may indicate low HCL, parasites, or cancer. Low levels may indicate liver dysfunction, leaky gut, gut problems, or low HCL.
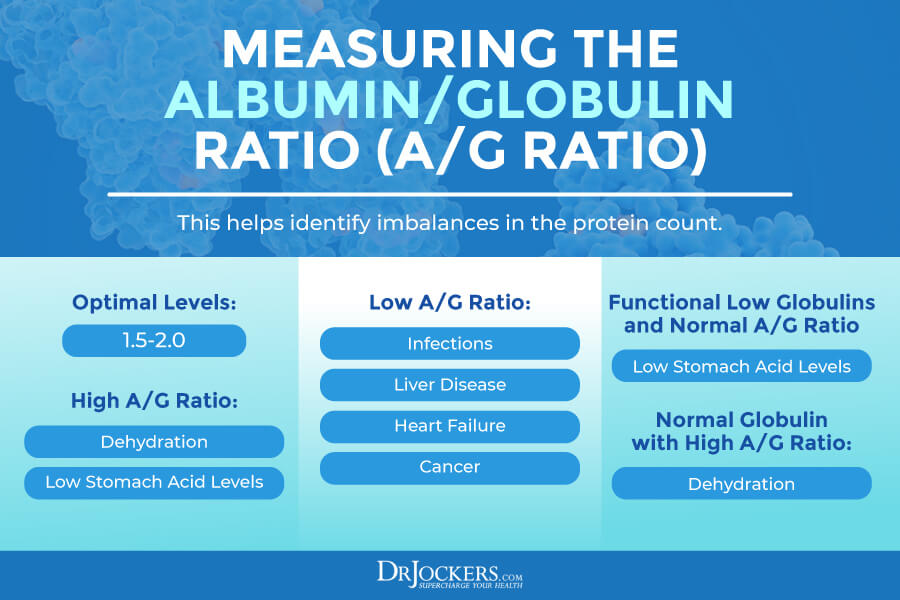
A/G Ratio
Your albumin and globulin matter a lot, however, their ratio is also important. The albumin globulin or A/G ratio is calculated by dividing your total albumin levels by your total globulins. It’s important to look at these factors, because an A/G ratio imbalance may still result in a normal protein count.
If we only look at the protein count, we may miss some issues. Liver problems, dehydration, and low HCL may all interrupt the normal A/G ratio. One may develop low globulins and a high A/G ratio because of low HCL. Normal globulin with a high A/G ratio may occur because of dehydration.
Optimal levels are between 1.5 and 2.0 units. High ratios may occur because of dehydration or low HCL. Low levels may be a result of infections, liver disease, heart failure, or cancer.
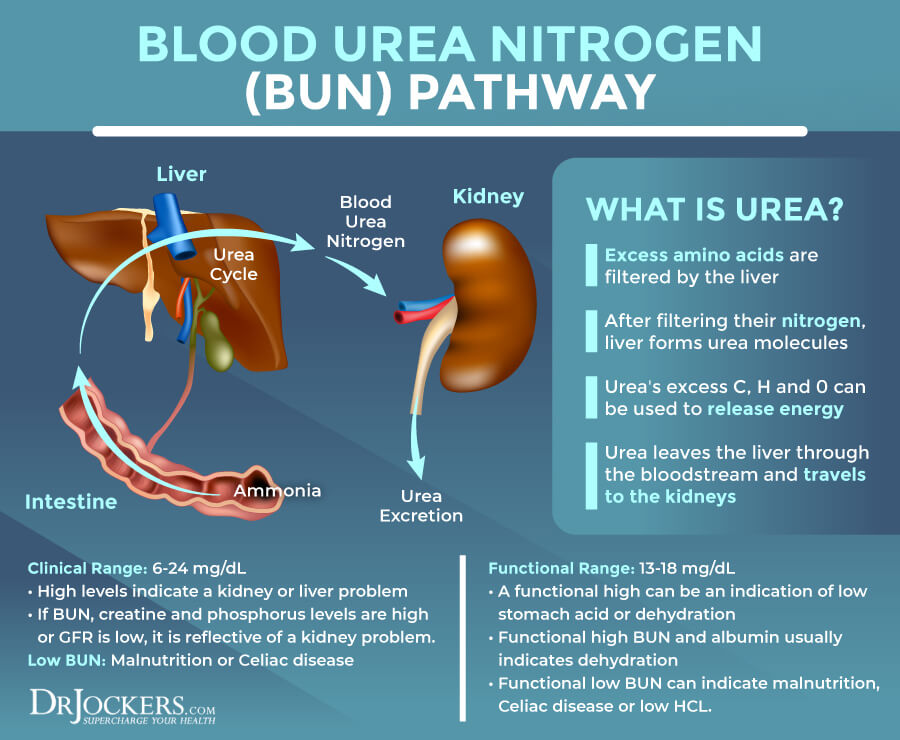
BUN
Blood urea nitrogen (BUN) is formed in the liver. It is the final step of protein metabolism. It is a waste product that your kidneys remove from your blood. High levels often indicate problems with kidney function.
The clinical range for BUN is 6 to 24 mg/dL. The optimal range is 13 to 18 mg/dL. High levels can be a kidney problem or high functional range levels often indicate low stomach acid or dehydration. If the BUN levels are high and your creatinine and phosphorus levels are high, it usually means kidney problems, while if only the BUN levels are high, it may be due to dehydration or low HCL.
High BUN and high albumin usually mean dehydration. Low levels can be too much hydration. Low BUN can also mean malnutrition, Celiac disease, or low HCL.
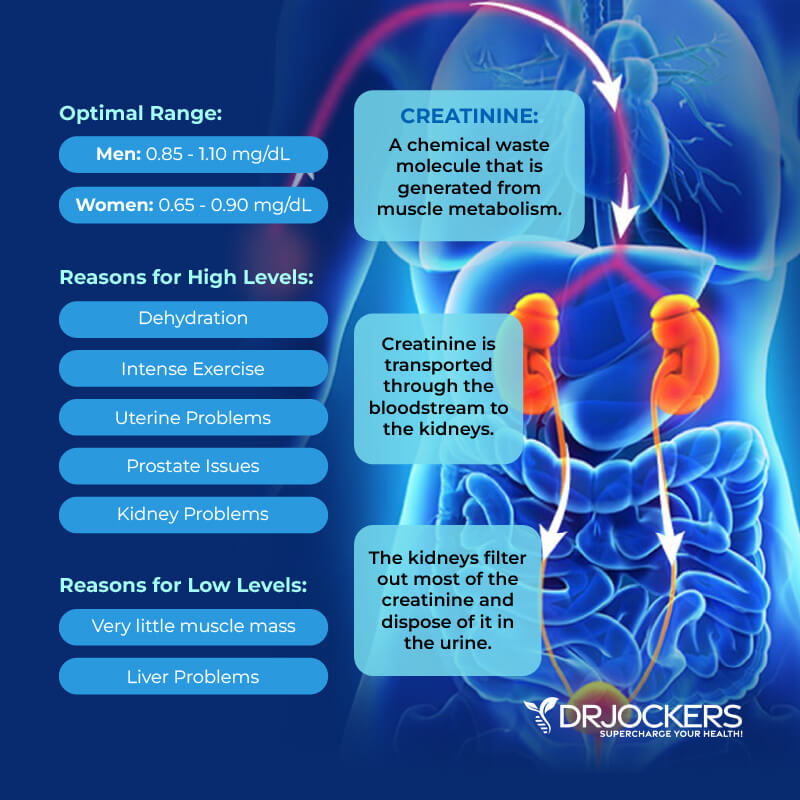
Creatinine
Creatinine is a part of your energy metabolism. It is another waste product. It’s created by muscle functions and is a byproduct of muscle creatinine phosphate. It is normally removed by your kidneys. High levels may mean that you have kidney issues.
The optimal range for creatinine for men is 0.85 to 1.10 mg/dL and for women, it’s 0.65 to 0.90 mg/dL. Elevated levels may develop because of dehydration, intense exercise, uterine problems, or prostate issues.
Low levels may indicate little muscle mass, being elderly with a small frame and low muscle mass, or liver disease. To rule out liver issues, it’s important to check your liver enzyme levels if your creatinine is low.
Sodium
Sodium is an important mineral and electrolyte. It is critical for various basic body functions, including fluid maintenance, muscle function, and nerve function. It is important for acid-base balance and osmotic pressure. Dehydration, high carb diet, high sodium diets, insulin resistance, or high stress can all cause sodium imbalances.
The optimal range for sodium is between 137 and 143 mmol/L. High levels may indicate dehydration, kidney problems, a high carbohydrate diet, or adrenal stress. Low levels may develop because of a low salt diet, dehydration, or adrenal exhaustion.
Potassium
Potassium is another critical mineral and electrolyte we need to look at. Potassium is critical for proper muscle function and heart function. It serves as a buffer within your cells and also as the main electrolyte of your intracellular fluid. Hypertension and kidney disease can often cause imbalances, both low and high levels. Dehydration, adrenal issues, poor sodium levels, or insulin resistance may also cause problems.
The optimal range for potassium is between 4.0 and 4.5 mmol/L. Elevated levels of potassium may indicate dehydration, adrenal hypofunction or exhaustion, or kidney problems. Low levels of potassium may indicate kidney problems, adrenal stress, diabetes, or diuretics use.

Chloride
Chloride is another essential electrolyte that affects fluid and pH balance. It is also a critical element in the development of HCL stomach acid. Adrenal stress and adrenal failure is often behind low chloride levels, while stress, insulin resistance, or aspirin use are common culprits of higher levels.
The optimal range for chloride is 100 to 106 mmol/L. Elevated levels of chloride may be a sign of adrenal stress, high salt diets, kidney problems, or too much aspirin. Low levels of chloride may indicate adrenal fatigue, low HCL, vitamin B1 deficiency, or kidney issues.
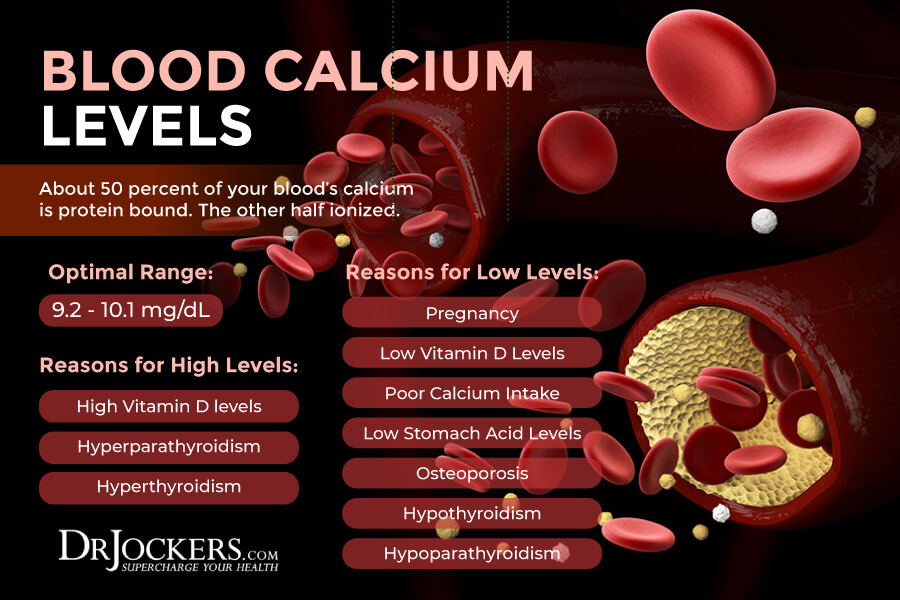
Calcium
Calcium is another key mineral and electrolyte. It is essential for bone formation, muscle function, and heart function. About 50 percent of your blood’s calcium is protein bound. The other half ionized. Thyroid replacement hormones and high vitamin D levels can often lead to high calcium levels. Thyroid issues and vitamin D imbalances may also lead to low levels.
The clinical range for calcium is between 8.6 – 10.2 mg/dL. Meanwhile, the functional optimal range for calcium is between 9.2 and 10.1 mg/dL. High levels may indicate high vitamin D or increased thyroid or parathyroid function. Low levels may develop due to pregnancy. They may also indicate low vitamin D levels, osteoporosis, low thyroid hormone levels, or low parathyroid levels.
Since low calcium levels usually indicate low vitamin D3, low thyroid, low magnesium, or all three of these issues, if your calcium is low, instead of supplementing with calcium, you probably need to focus on correcting one or all of these issues.
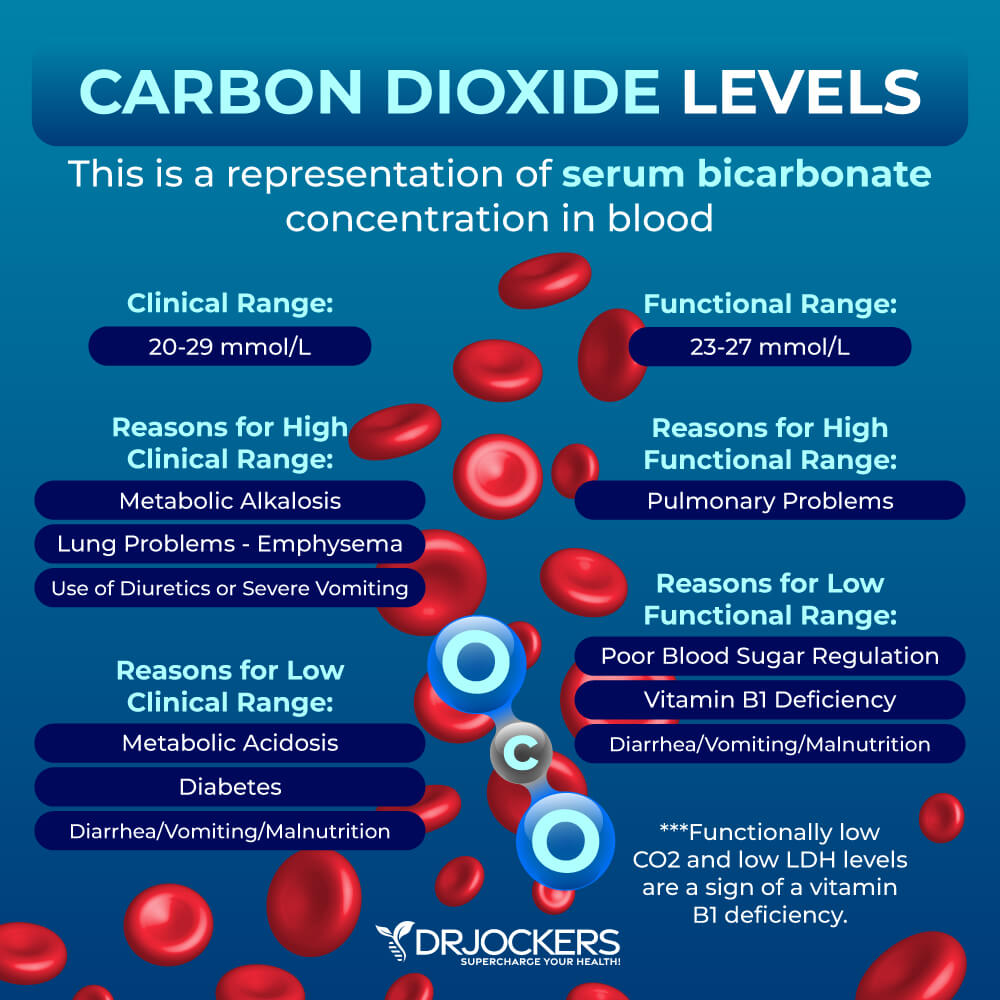
Carbon Dioxide
We also need to check for carbon dioxide (CO2) levels. Serum CO2 levels show an increase in serum bicarbonate concentration instead of reflecting of dissolved CO2 gas. Elevated levels usually indicate pulmonary issues.
The clinical range for CO2 is 20-29 mmol/L. High levels may develop because of emphysema, use of diuretics, severe vomiting, or blood alkalosis. Low levels may be a sign of blood acidosis, diabetic acidosis, starvation, or severe diarrhea.
The optimal range for CO2 is 23 to 27 mmol/L. Low levels are often associated with poor blood sugar regulation. B1 deficiency may also cause both low CO2 levels and low lactate dehydrogenase (LDH) levels under 140. Diarrhea, vomiting, and low nutrition may also cause problems.
Anion Gap
The anion gap check for the difference between the sum of sodium and potassium and the sum of chloride and bicarbonate. If you are well-versed in chemistry, this is a great representation of the anion gap: the anion gap = (Na + K) – (C1 + CO2). This gap may help to spot kidney, lung, adrenal and other organ function problems.
The optimal range for the anion gap is between 7 and 12 mmol/L. The anion gap increases with dysglycemia, ketogenic diets, diabetic ketoacidosis, alcoholic ketoacidosis, fasting, starvation, salicylate toxicity and lactic acidosis.
High levels may also indicate adrenal fatigue or B1 deficiency. Dehydration, kidney issues, diarrhea, too much exercise, and ketoacidosis may also be potential culprits. Low levels are most commonly a lab error but in some cases, low levels may be due to hyperparathyroidism, kidney problems, heart disease, and certain cancers.
Low Stomach Acid Pattern:
Stomach acid (HCL) is critical for digesting protein, absorbing key minerals such as calcium, iron, zinc and phosphorus. It is also very important for sterilizing food coming into our body and keeping the overall bacterial and microbial balance in order.
As people age or if they have certain infections, stressors or other health problems, they lose the ability to produce enough HCL to properly absorb nutrients and keep their microbiome in balance. When this happens, it can cause a wide variety of health problems.
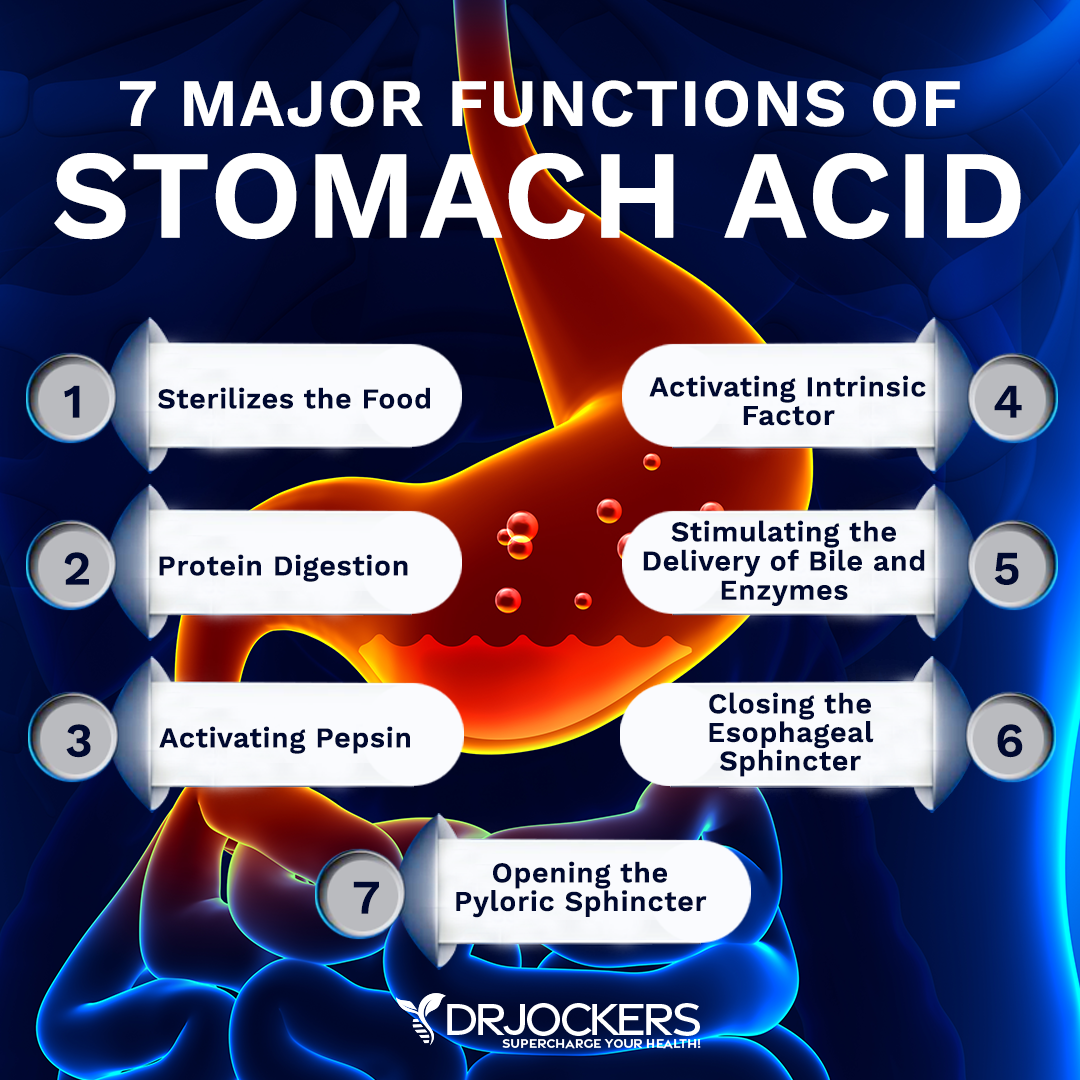
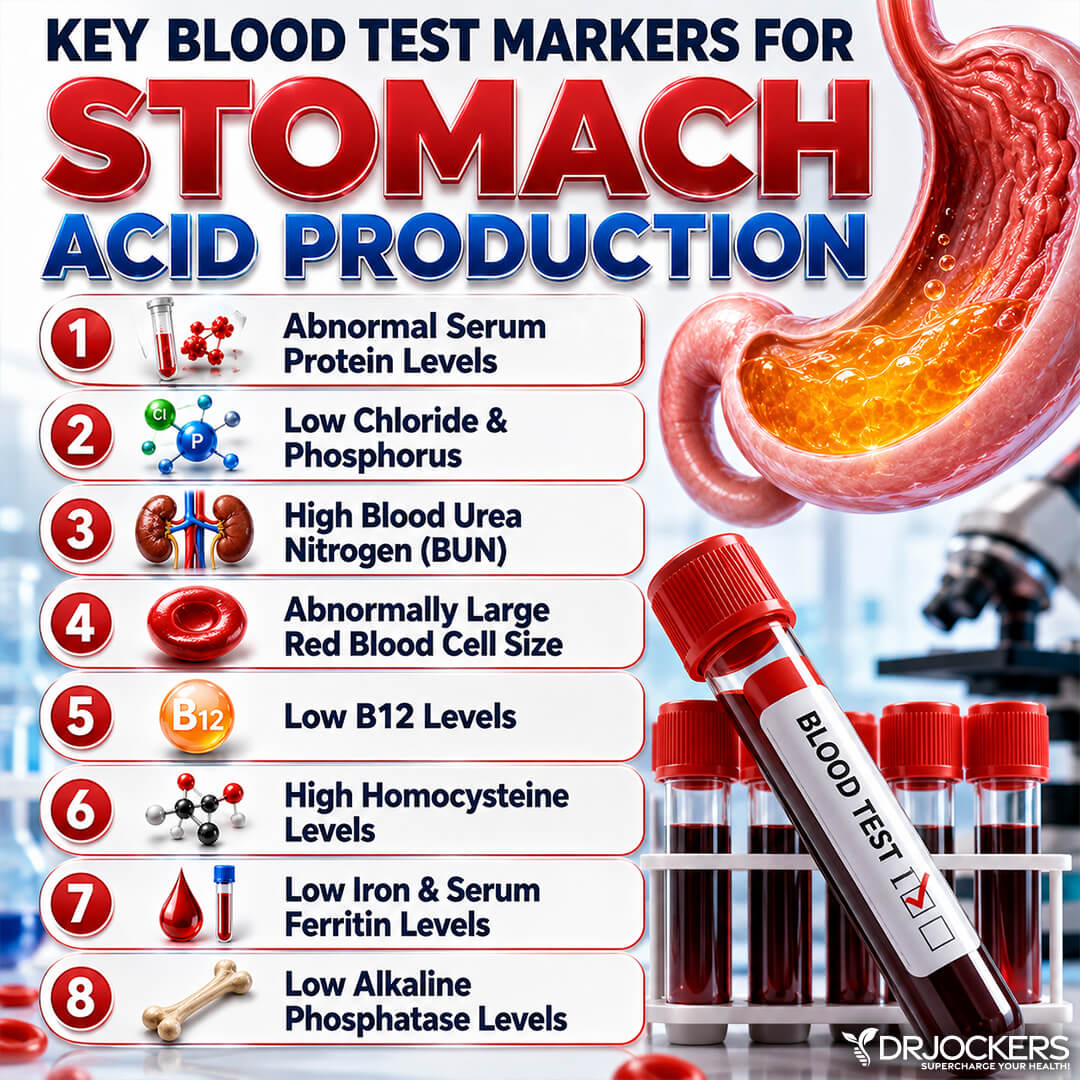
A classic pattern for low HCL as seen on functional blood analysis includes the following: Low total proteins (under 6.9), low BUN (under 13), low globulins (under 2.4) and high A/G Ratio (over 2.0), low chloride (under 100), high MCV (over 92).
If you have other available labs, you may see low zinc levels (under 90), low B12 (under 800), low serum iron (under 85) may also be seen. On other labs, such as the GI MAP test, you may see high steatocrit and low elactase levels.
Comprehensive Blood Analysis
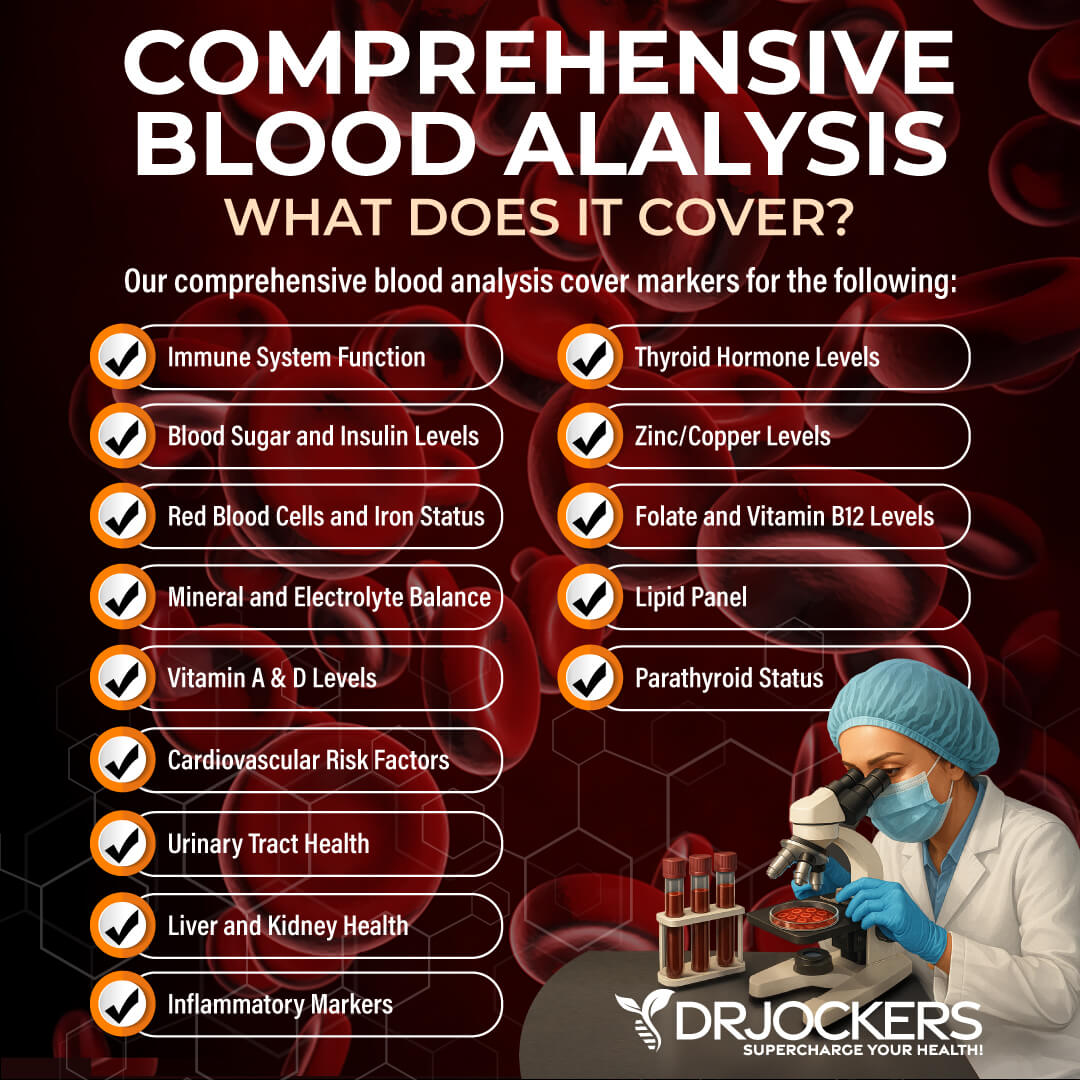
To receive a functional blood analysis and look at the optimal ranges of these markers, I recommend and regularly use a Comprehensive Blood Analysis (CBA), which is a very detailed blood test that looks at all of these markers of inflammation and other health functions.
This test is more sophisticated than most conventional doctors run. It looks at everything that a CBC and CMP do and more. It examines all parameters for inflammation, blood sugar levels, insulin levels, immune system function, thyroid function, parathyroid hormone levels, mineral and electrolyte balance, zinc and copper ratio, vitamin A and D levels, folate and vitamin B12 levels, a complete metabolic panel, complete blood count, liver function, kidney function, urinary tract health, nutrient deficiencies, and more.
I recommend getting the Comprehensive Blood Analysis done regularly both as a preventative measure and to monitor your inflammation levels and progress if you are on a treatment plan. Remember, our team is always happy to help to understand your results and create a personalized treatment protocol to regain your health and well-being naturally.
Final Thoughts
Normal doesn’t always mean optimal. Looking at the optimal ranges of two functional blood analysis tests, the Complete Blood Count (CBC) and the Complete Metabolic Panel (CMP) can help us to identify subclinical health challenges, recognize underlying health issues, and understand your risk of disease.
I highly recommend the Comprehensive Blood Analysis (CBA) to look at these markers. Understanding your markers can help us, functional medicine practitioners, to offer a treatment plan to move your markers to the optimal range, correct underlying and subclinical health challenges, and regain your energy, health, and well-being naturally.
If you want to work with a functional health coach, I recommend this article with tips on how to find a great coach. On our website, we offer long-distance functional health coaching programs. For further support with your health goals, just reach out—our fantastic coaches are here to support your journey.

Inflammation Crushing Ebundle
The Inflammation Crushing Ebundle is designed to help you improve your brain, liver, immune system and discover the healing strategies, foods and recipes to burn fat, reduce inflammation and Thrive in Life!
As a doctor of natural medicine, I have spent the past 20 years studying the best healing strategies and worked with hundreds of coaching clients, helping them overcome chronic health conditions and optimize their overall health.
In our Inflammation Crushing Ebundle, I have put together my very best strategies to reduce inflammation and optimize your healing potential. Take a look at what you will get inside these valuable guides below!


That is a pretty impressive list of tests. I just visited my GP and he sent me for blood work and I’d be surprised if there were more than 6 items on the lab work. I did ask for Vit D and iodine testing. He said no to iodine. When I went to lab and asked about iodine testing, they claimed to not know if it existed.
What does it cost to do your list of testing? I am in Canada. Thank you, Marlene
Hello Marlene,
Here is the Comprehensive Blood analysis. It dosn’t test iodine, but does test almost everything else: https://drjockers.com/comprehensive-blood-analysis/
It is disappointing that doctors do not see the importance of testing iodine. They’re all 15 years behind and consider it rare or global therefore not necessary——antiquated!
I lost my t4/t3 in 2019. Everyone told me I was fine yet I was trashed an couldn’t work. Fast forward had my iodine tested and I had none! The cause of no t4/t3. Replenished on my own a lessened my terrible headaches/migraine considerably. You can have your own labs done without a physician.
Follow your gut and have it tested!
No one has yet to help me as thyroid meds do not work on me. They don’t think beyond TSH/T4 test. Comments made abt these doctors is not to be
unkind. I study the endocrine system an thyroid physics.
Good luck!
Great reference article. Thank you for putting this resource together.
What a wonderful and informative article. My God. My lab work is not at all reflecting the
” your labs look great ” I got from the girl in the Dr’s office that called me with results and not the Dr. Could you please tell me if a folate level of 18 is in range as well as a Ferritin of 45 ? Platelets were 310 and Basophils Relative 0.4%. This article really gives me hope. Thank you so much.
Glad to hear this was so helpful for you Julie! Blessings to you!
Much thanks Doctor, such a great analysis!
Do you have any info (advice / articles / videos anything) specifically for vegetarians?
For instance if there are optimal blood levels that are different for such people?
From what I learned B12 levels would not need to be as high as for a meat eater and I wonder if there are other such facts..?
Much thanks!
What would an eosinophils count of 0.6 on a allopathic WBC be on a Functional Medicine CBC can you tell me that?
For the allopathic method to get the complete count I guess you times the eosinophil by the WBC which comes out to 3.54.
What about optimal ranges for magnesium level, bilirubin total, ALT, AST, Iron, TIBC, Ferritin, Glucose levels, eGFR CKD EPI and BUN Creatinine ratio?
I also can’t find any reliable optimal ranges for neutrophil, absolute or lymphocyte absolute.
Optimal ranges for any of these stats would be greatly appreciated. Google searches keep showing clinical norms.
Yes we review many of those in these articles: https://drjockers.com/testing-liver-function/
Anemia: https://drjockers.com/anemia/
I am interested in ordering a Comprehensive Blood Analysis from you. Who will interpret the results for me?
Hello Sandy, yes one of our health coaches will reach out to help you with this. https://drjockers.lpages.co/long-distance-coaching-dr-jockers/
Yes one of our functional health coaches can assist you: https://drjockers.lpages.co/long-distance-coaching-dr-jockers/
I have been on thyroid medication for over 20 years, I saw Mayo Clinic in Jacksonville and was diagnosed with Hashimoto’s. As we moved around the country I have seen many doctors and have been adjusted as my levels changed but have never gotten rid of my brain fog, tiredness, weight gain (working out +diet) dry skin, hair loss, etc.
My Endocrinologist only has blood tested for T4 Free and TSH II. I just had a MRI and neck CT for a neck issue and the findings also say that three is no evidence of a thyroid and to provide date removed, I never had it removed. My Endocrinologist says we treat me the same way as if I still had a thyroid and nothing I read talks about a thyroid disappearing.
Sorry to hear about that! I would recommend consulting with one of our functional health practitioners: https://drjockers.lpages.co/long-distance-coaching-dr-jockers/
Thank you for writing this blog! Can you recommend a book that uses these functional values to add to my collection?
As a functional medicine student I am curious to your optimal functional levels for ferritin.
Thanks for your reply.
This is a wonderful article. Thank you for your thorough explanation. There is not enough focus on optimal versus normal. Very valuable. Thank you!
Thank you!